If you’ve been wondering how to turn your raw data into stunning, interactive dashboards, Getting Started with Looker Studio is your first step. Formerly known as Google Data Studio, Looker Studio makes it easy to create data visualizations that are customizable, dynamic, and best of all—free!
All you need to begin is your Google account login.
Step 1: Log in to Looker Studio
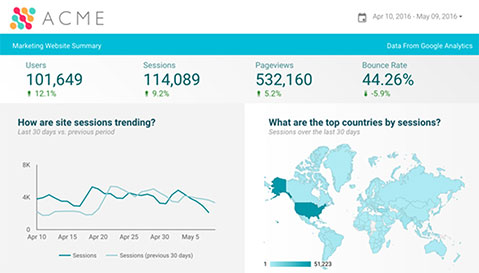
Head over to lookerstudio.google.com and sign in with your Google account. Once inside, locate the ”[Sample] Acme Marketing Website” template and make a copy of it to start building your own report.
Step 2: Connect Your Own Data Source
To personalize your report, you’ll need to switch out the sample data with your own:
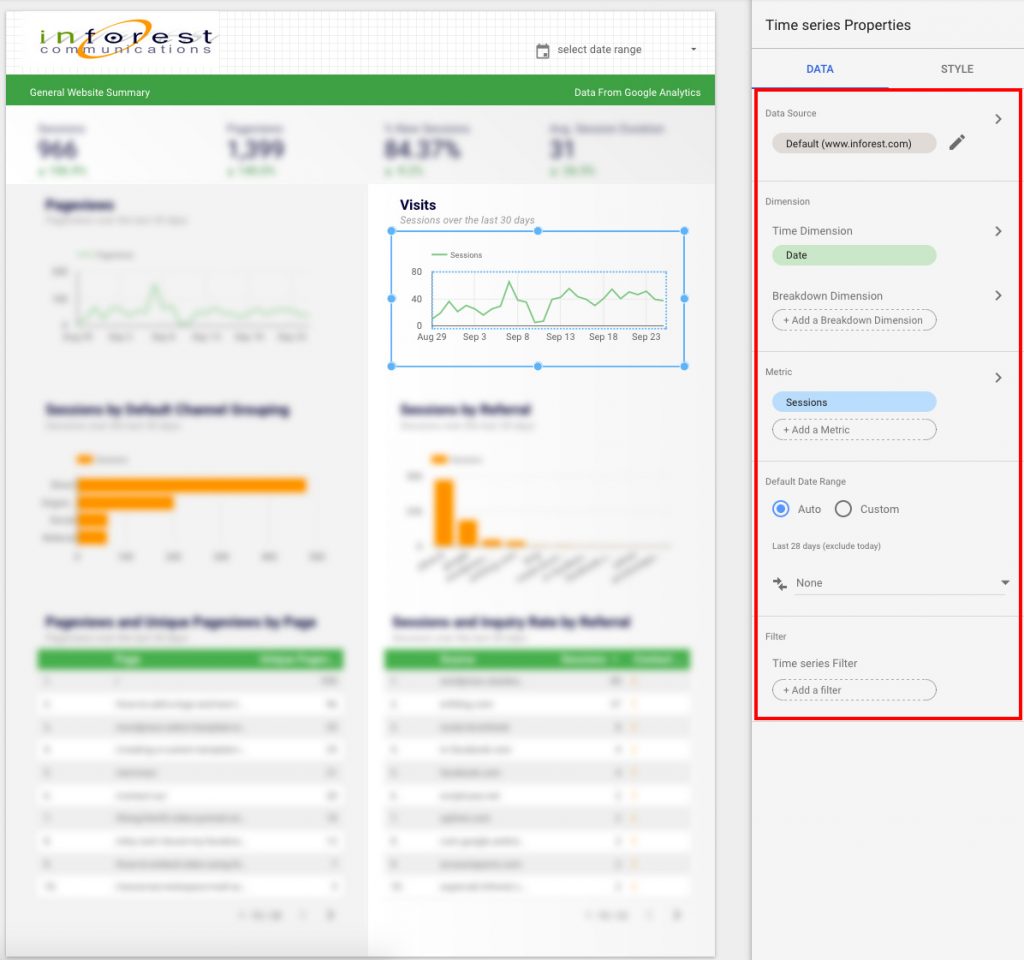
1. Toggle the blue “Edit” slider in the top right to enter edit mode.
2. Click any chart or use the page settings panel.
3. Below the chart, click the “Data” tab.
4. Next to Data Source, click the right arrow, then the blue “Create New Data Source” button.
5. Select a data source, such as Google Analytics.
6. Choose the account view you’d like to use.
7. Click Connect, then Add to Report, and confirm.
You’re now pulling real data into your report!
Note: The examples below are made using our template in which we made additional modifications.
Step 3: Customize Your Report
Want to personalize the way your data looks? You can edit Metrics, Dimensions, and even apply Filters—just like you would in Google Analytics. Here’s where the real power of Looker Studio kicks in.
TIP:
Open your Google Analytics dashboards in another tab. Use them as a guide to recreate or improve widgets in Looker Studio.
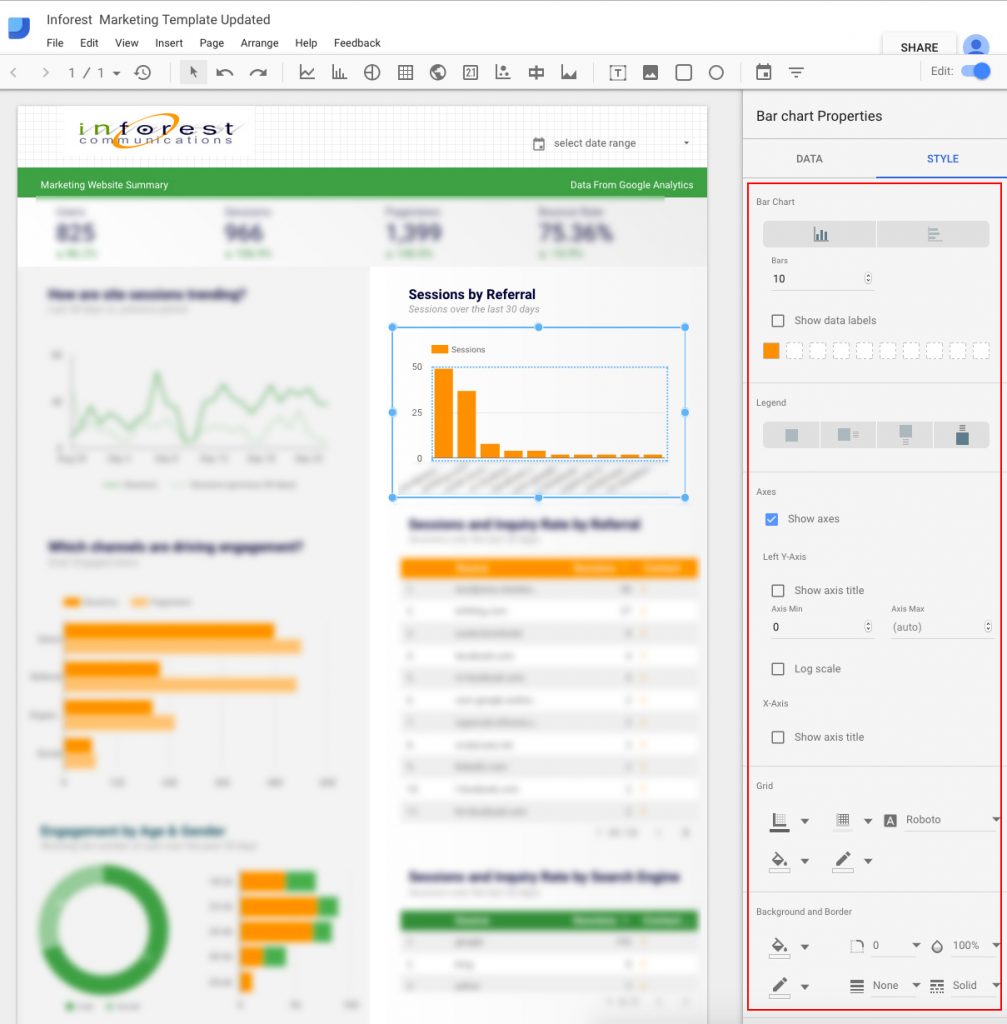
Step 4: Style Like a Pro
Click on any chart or widget and switch to the Style tab. From there, you can:
• Change colors, fonts, and alignment
• Add your company logo, background colors, and custom images
• Use the top navigation to add text, shapes, or new pages
• Drag-and-drop elements to fine-tune your layout
Looker Studio allows endless customization—perfect for marketing teams, clients, or internal reporting.
Step 5: Go Beyond Google Analytics
While Looker Studio is amazing for Google Analytics, you can also connect to:
• YouTube Analytics
• Cloud SQL
• MySQL
• Attribution 360 and more
The platform supports dozens of connectors, giving you flexibility no matter where your data lives.
Final Thoughts
Getting Started with Looker Studio is easier than ever. With just a few clicks, you can build an interactive, branded, data-driven dashboard that impresses your stakeholders. Whether you’re visualizing web traffic, campaign performance, or YouTube views, Looker Studio offers a powerful, free solution.
Need help diving deeper? Check out Google’s official Looker Studio Help Guide.
Transform Your Online Presence Today!
Let’s build a website that not only looks great but drives real results. Get started with expert web development and digital marketing!

