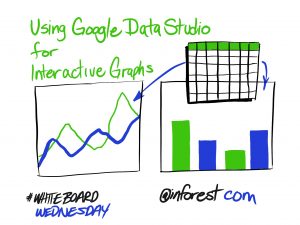
Using Google Data Studio for Interactive Graphs
The Looker Studio COVID-19 Data Project at gacovid19.org brought together research, technology, and storytelling to deliver timely economic insights during a global pandemic. Led by Georgia Tech students, the site publishes weekly economic reports, industry-specific updates, and podcast episodes—all supported by live interactive charts built with Looker Studio. As collaborators, our mission was to help identify the best tool to visualize …